BCG Model

 |
BCG Model |
 |
|
Articles | Books | Dictionary | Faq | Home | Leaders | Organizations | Search
|
BCG Matrix |
Product Portfolio Management: Summary of the BCG Model. Abstract |
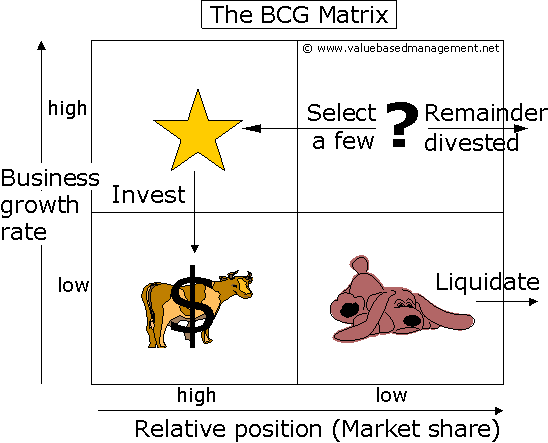
The BCG Model is based on the product life cycle theory that can be used to determine what priorities should be given in the product portfolio of a business unit. To ensure long-term value creation, a company should have a portfolio of products that contains both high-growth products in need of cash inputs and low-growth products that generate a lot of cash. It has 2 dimensions: market share and market growth. The basic idea behind it is that the bigger the market share a product has or the faster the product's market grows the better it is for the company.

Placing products in the BCG matrix results in 4 categories in a portfolio of a company:
1. Stars (=high growth, high market
share)
- use large amounts of cash and are leaders in the business so they should
also generate large amounts of cash.
- frequently roughly in balance on net cash flow. However if needed any
attempt should be made to hold share, because the rewards will be a cash
cow if market share is kept.
2. Cash Cows (=low growth,
high market share)
- profits and cash generation should be high , and because of the
low
growth, investments needed should be low. Keep profits high
- Foundation of a company
3. Dogs (=low growth, low
market share)
- avoid and minimize the number of dogs in a company.
- beware of expensive ‘turn around plans’.
- deliver cash, otherwise liquidate
4. Question Marks (= high
growth, low market share)
- have the worst cash characteristics of all, because high demands and low
returns due to low market share
- if nothing is done to change the market share, question marks will
simply absorb great amounts of cash and later, as the growth stops, a dog.
- either invest heavily or sell off or invest nothing and generate
whatever cash it can. Increase market share or deliver cash
The BCG Method can help understand a frequently made strategy mistake: having a one-size-fits-all-approach to strategy, such as a generic growth target (9 percent per year) or a generic return on capital of say 9,5% for an entire corporation.
In such a scenario:
A. Cash Cows Business Units will beat their profit target easily; their management have an easy job and are often praised anyhow. Even worse, they are often allowed to reinvest substantial cash amounts in their businesses which are mature and not growing anymore.
B. Dogs Business Units fight an impossible battle and, even worse, investments are made now and then in hopeless attempts to 'turn the business around'.
C. As a result (all) Question Marks and Stars Business Units get mediocre size investment funds. In this way they are unable to ever become cash cows. These inadequate invested sums of money are a waste of money. Either these SBUs should receive enough investment funds to enable them to achieve a real market dominance and become a cash cow (or star), or otherwise companies are advised to disinvest and try to get whatever possible cash out of the question marks that were not selected.
Some limitations of the Boston Consulting Group Matrix include:
High market share is not the only success factor
Market growth is not the only indicator for attractiveness of a market
Sometimes Dogs can earn even more cash as Cash Cows
Book: Carl W. Stern, George Stalk - Perspectives on Strategy from The Boston Consulting Group
| 👀 | TIP: To learn more, have a look at the BCG Matrix center: Summary, forum, tips and tools. |
Compare with the BCG Matrix: GE / McKinsey Matrix | ADL Matrix | Core Competence | Bass Diffusion model | Relative Value of Growth | STRATPORT | Profit Pools | Product Life Cycle | Blue Ocean Strategy | Four Trajectories of Industry Change | Positioning
About us | Advertise | Privacy | Support us | Terms of Service
©2025 Value Based Management.net - All names tm by their owners